Comments on Quantifying the impact of the Dutch welfare state
Introduction
Overview
Structure of my feedback:
- Short Summary
- Policy Evaluation and Methodology
- Illustration and Research Ideas
- Other Ideas
Short Summary
- The research aims to quantify the financial impact of the Dutch welfare state between 1950 and 1975
- Analyzing whether the actual economic outcomes matched the initial political-economic objectives of the policymakers.
- The period is characterized by post-WWII reconstruction, massive economic growth, and a general decrease in income inequality.
- It marks the transition from fragmented worker insurance to a “universal” national insurance system.
- Shift from a “corporatist” to “unversalist” model based on citizenship.
- But despite the move toward universalism, cultural criteria (such as “non-Western” household habits) were historically used to deny eligibility—a phenomenon the project intends to quantify.
- Paper brings forth various examples cases to illustrate broad trends mentioned above.
Impressions
Welfare state models across many European countries, long considered socio-economic constants, are now under escalating pressure to retrench (Heijne, 2018). To fully assess the ramifications of this scaling back, it is essential to first understand the system’s historical impact. Therefore, analyzing how the welfare state has influenced core political-economic outcomes, particularly the distribution of inequality, becomes a crucial research imperative.
- I think this is a really good motivation.
- Idea of variation in exposure (access) to welfare state also very nice.
- But unclear where this variation could come from.
- In what follows, I will offer some suggestions and data sources..
Policy Evaluation
Typology
Various important laws with different ramifications were accepted during this period:
- Old age
- Noodwet Ouderdomsvoorziening (1947)
- Algemene Ouderdomswet (AOW) (1957)
- Safety net
- Algemene Bijstandswet (1965)
- Employee insurance
- Werkloosheidswet (1949)
- Wet op de arbeidsongeschiktheidsverzekering (WAO) (1967)
- Family assistance
- Algemene Weduwen- en Wezenwet (AWW) (1955)
- Algemene Kinderbijslagwet (1963)
- Ziekenfondswet (1964)
- Old age
Policy Evaluation
- I think you really need either (or both of two things):
- Individual or household level microdata.
- You have obtained a dataset at the household level from your supervisors.
- Describe well what is in there.
- What variables, at what level?
- How can it be linked to other data? E.g. place of residence?
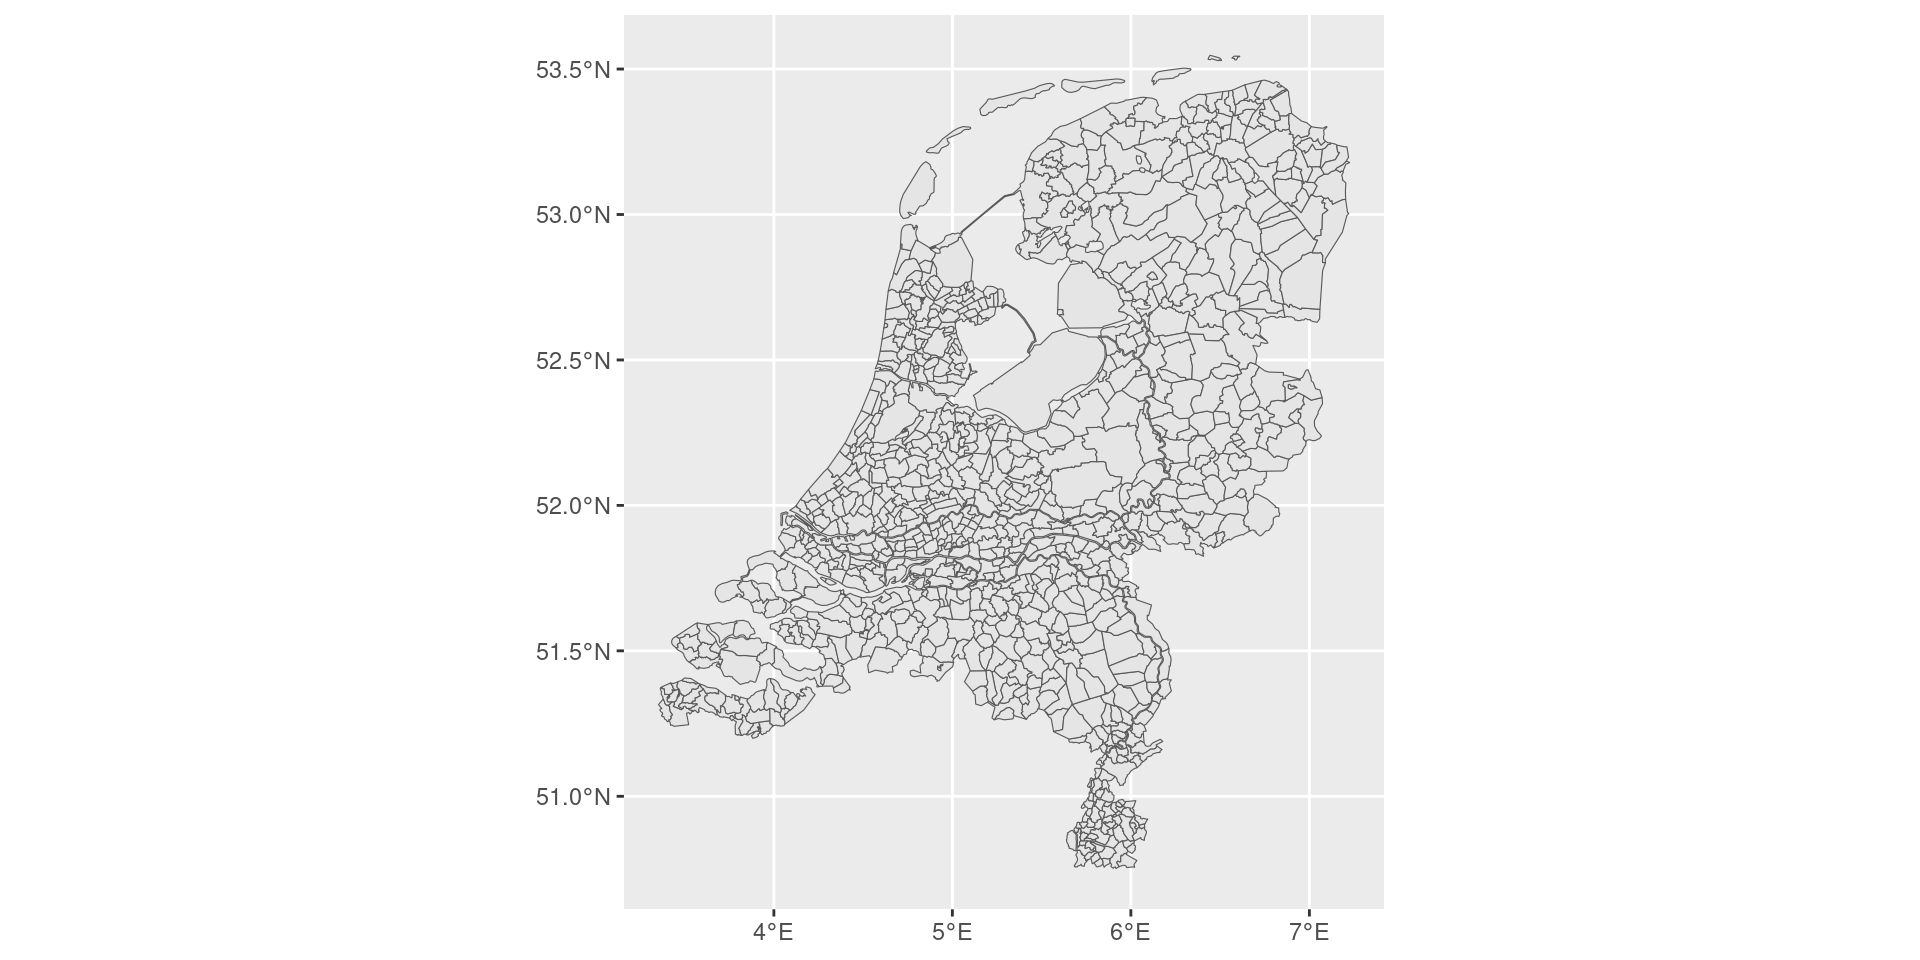
- Aggregated level at the municipality level.
- In about 1970 there are 913 different municipalities, which is quite granular.
Three Approaches (I)
- Difference-in-Differences (DiD) using Occupational Microdata.
- Treatment group: individuals/households who received a massive “positive income shock”.
- Control group: ineligible individuals.
- Data: genealogy records (geni.com, genealogieonline.nl, openarch.nl, wiewaswie.nl) or HSN, see also this).
Three Approaches (II)
- Municipality-Level “Intensity of Treatment”.
- Logic: Some municipalities had a high density of people vulnerable to the policy, while others did not.
- Can be combined with panel data or difference-in-difference to control for “selection” (high density-municipalities are different from low-density municipalities).
- Data: Census data, various other municipal-level data available through cbsodataR or HDNG.
Municipality-level Data
- Still have a lot of municipalities in 1970 (913), so potentially allows for reliable inference.
Three Approaches (III)
- Using cut-offs.
- Logic: some policies featured discontinuities or variable incentives based on some cut-off point e.g. in earned income.
- These can be exploited to study the impact of that discontinuous change if it is not that easy to manipulate income.
- Method: regression discontinuity (but make sure your sample is large enough!)
- Data: Again, HSN (Historical Sample of the Netherlands) or municipal-level demographic statistics.
Illustrations
Bijstandswet
The Bijstandswet from 1965 replaced the old “Poor Law” (Armenwet of 1912).
- Under the Poor Law, aid was a favor (charity) and often came from churches; under the ABW, financial assistance became a statutory right for any citizen who could not provide for themselves.
There is a nice database about associations involved in poor relief and poverty prevention.1
Did the Bijstandswet kill voluntary associations?
Empirically, a design could make use of variation in poverty/unemployment in municipalities:
- Poor municipalities are expected to be impacted more heavily by the law than rich municipalities: \(\text{no. verenigingen}_{it} = \alpha + \beta_1 \text{poverty}_{it} + \beta_2 \text{bijstandswet}_{t} + \beta_3 \text{poverty $\times $ bijstandswet}_{it} + \epsilon_{it}\)
- Potentially this could also shed some light on the ethnicity/migrant origin question by looking at which associations persist and which perish.
Noodwet Ouderdomsvoorziening
A temporary measure to provide state pensions to the elderly, marking the first time the state took direct financial responsibility for the elderly regardless of their employment history.
Figure from Wikipedia (don’t know how reliable but still):
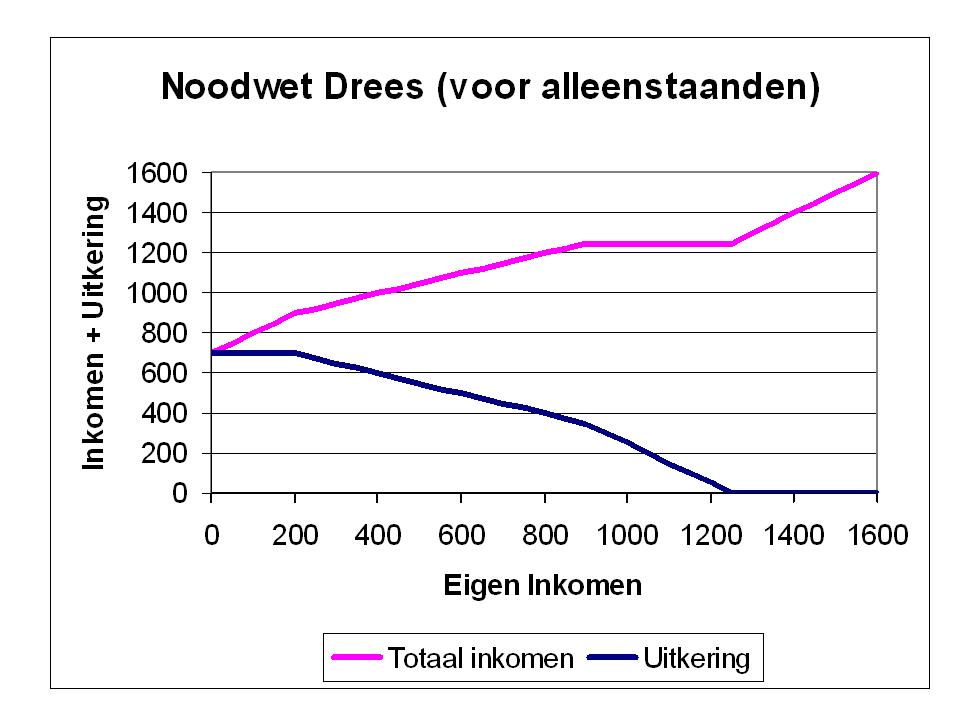
- If you have microdata on income, you could compare elderly households with an income of about 800 (whose income gets bumped up to 1200 euro because of the law) to people with an income of about 1200 (whose income stays about 1200 euro after the law).
- In a difference-in-difference set-up.
Child Benefits
- If you have access to relevant microdata, you could dynamically compare households with and without children using a difference-in-differences methodology.
- One group is touched by the reform (those with children), the other group is not.
- Alternatively: exploit the changes in benefits (here are the numbers) to analyze the decision to have an extra child.
- Separates the general cultural trend (people wanting fewer kids) from the financial incentive (people having that one extra kid because the state pays for it).
- At a more aggregate level, you could use local differences in demographics (municipalities with more vs. municipalities with fewer children) to compare outcomes at the municipality level:
- \(\text{fertility}_{it} = \alpha + \beta_1 \text{fertility}_{it-1} + \beta_2 \text{post kinderbijslag}_{t} + \beta_3 \text{fertility}_{it-1} \times \text{post kinderbijslag}_t + \epsilon_{it}\)
Other Ideas
Parliamentary Debates
- Parliamentary debates and voting outcomes also interesting as a source.
- Close reading and summarizing is worthwhile, but..
- Also possible to use AI tools (see here) to summarize and extract valuable information:
- Staten Generaal Digitaal has all parliamentary transcriptions and also voting outcomes in parliament.
- The OCR isn’t that good but could potentially be done again.
- Alternative: Annotated ParlaMINT data
- Potential questions: focus on the characteristics and incentives of politicians (e.g. age/marital status/have children yourself, and analyze willingness to support e.g. Kinderbijslag)
- Voting behavior at this point in time already subject to discipline1, but analyzing debates might reveal politicians’ real positions!
Conclusion
Concluding Remarks
- Broad outline of PhD thesis with a lot of interesting ideas.
- Data could be an important bottleneck.
- But I also think that is soluble - your time period has loads of interesting data sources.
- Both methodologically and qualitatively, there is a lot of interesting stuff to do.
Some Limitations
- Ethnicity is a difficult factor to focus on.
- Many things are multicollinear:
- Ethnicity
- Social origin
- Possibly religion
- Place of residence
- Income
- (Being deprived of) access to the welfare state
- Hence it is difficult to come up with a plausible counterfactual, as in what would have happened to this group if they wouldn’t have been deprived of welfare state access.
![]()